How To Use Z Table? Easy Standard Normal Lookup

The Z-table, also known as the standard normal distribution table, is a powerful tool in statistics that helps you find the probability of a value occurring within a standard normal distribution. This distribution is a probability distribution that is symmetric about the mean, showing that data near the mean are more frequent in occurrence than data far from the mean. In this explanation, we will delve into how to use the Z-table for looking up probabilities in a standard normal distribution.
Understanding the Standard Normal Distribution
Before using the Z-table, it’s essential to understand what a standard normal distribution is. A standard normal distribution is a normal distribution with a mean (μ) of 0 and a standard deviation (σ) of 1. The Z-table is used to find the area under the standard normal curve to the left of a given Z-score. This area represents the probability that a random variable with a standard normal distribution will be less than or equal to the given Z-score.
What is a Z-Score?
A Z-score indicates how many standard deviations an element is from the mean. A Z-score is calculated using the formula:
[ Z = \frac{X - \mu}{\sigma} ]
Where: - (X) is the value of the element, - (\mu) is the mean of the dataset, - (\sigma) is the standard deviation of the dataset.
Using the Z-Table
To use the Z-table, follow these steps:
Calculate the Z-Score: First, you need to calculate the Z-score for your given value using the formula above. Make sure you know the mean and standard deviation of your dataset.
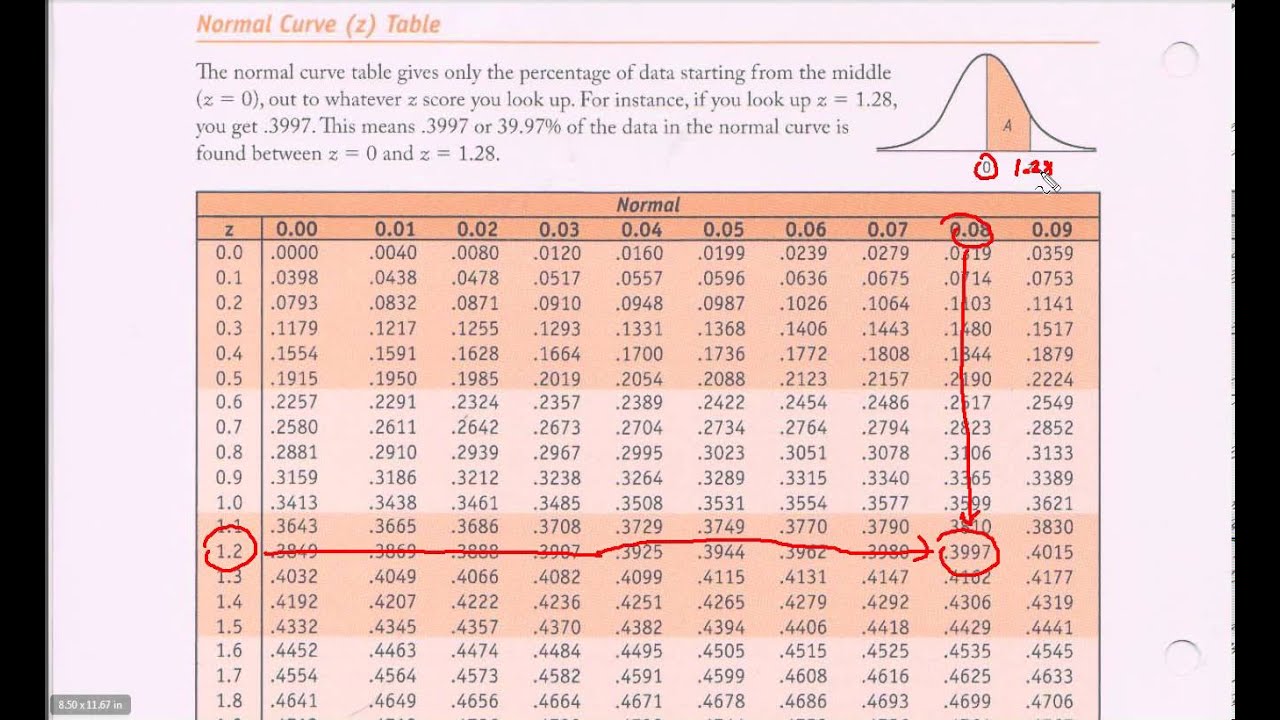
Identify the Z-Score in the Table: The Z-table is arranged with Z-scores on the leftmost column and at the top row. The body of the table contains the probabilities (areas under the curve) associated with these Z-scores. Find your calculated Z-score in the table. If your Z-score has more decimal places than what is listed, you can round it to the nearest hundredth or use interpolation methods for more precise calculations.
Determine the Direction of the Lookup: Depending on what you’re trying to find (e.g., the probability that a value is less than, greater than, between two values, etc.), you might need to look up your Z-score and then interpret the table’s value accordingly. For instance, if you want to find the probability that a value is less than a certain Z-score, you directly read the value from the table.
Read the Probability: Once you’ve located your Z-score, read the corresponding probability from the table. This value represents the area under the standard normal curve to the left of your Z-score, which is the probability that a random variable with a standard normal distribution will be less than or equal to your given value.
Interpreting the Results
- Less Than: If you’re looking for the probability that a value is less than a certain Z-score, the value directly from the Z-table is your answer.
- Greater Than: To find the probability that a value is greater than a certain Z-score, subtract the Z-table value from 1. This is because the total area under the standard normal curve is 1 (or 100%).
- Between Two Z-Scores: To find the probability that a value falls between two Z-scores, look up both Z-scores in the table and subtract the smaller probability from the larger one.
Example
Suppose you want to find the probability that a value is less than 1.5 standard deviations above the mean in a standard normal distribution.
- Calculate the Z-score: Since we’re dealing directly with standard deviations from the mean in a standard normal distribution, the Z-score is 1.5.
- Find the Z-score in the table: Looking at the Z-table, the probability associated with a Z-score of 1.5 is approximately 0.9332. This means there’s about a 93.32% chance that a value will be less than 1.5 standard deviations above the mean.
Conclusion
The Z-table is a powerful tool for working with standard normal distributions, allowing you to easily look up probabilities associated with given Z-scores. By understanding how to calculate Z-scores and interpret the Z-table, you can solve a variety of statistical problems involving probabilities and areas under the standard normal curve.
FAQ Section
What is the Z-table used for?
+The Z-table, or standard normal distribution table, is used to find the probability of a value occurring within a standard normal distribution. It helps in looking up the area under the standard normal curve to the left of a given Z-score.
How do I calculate a Z-score?
+A Z-score is calculated using the formula (Z = \frac{X - \mu}{\sigma}), where (X) is the value, (\mu) is the mean, and (\sigma) is the standard deviation.
What does a Z-score represent?
+A Z-score indicates how many standard deviations an element is from the mean. A positive Z-score indicates the value is above the mean, while a negative Z-score indicates it’s below the mean.


