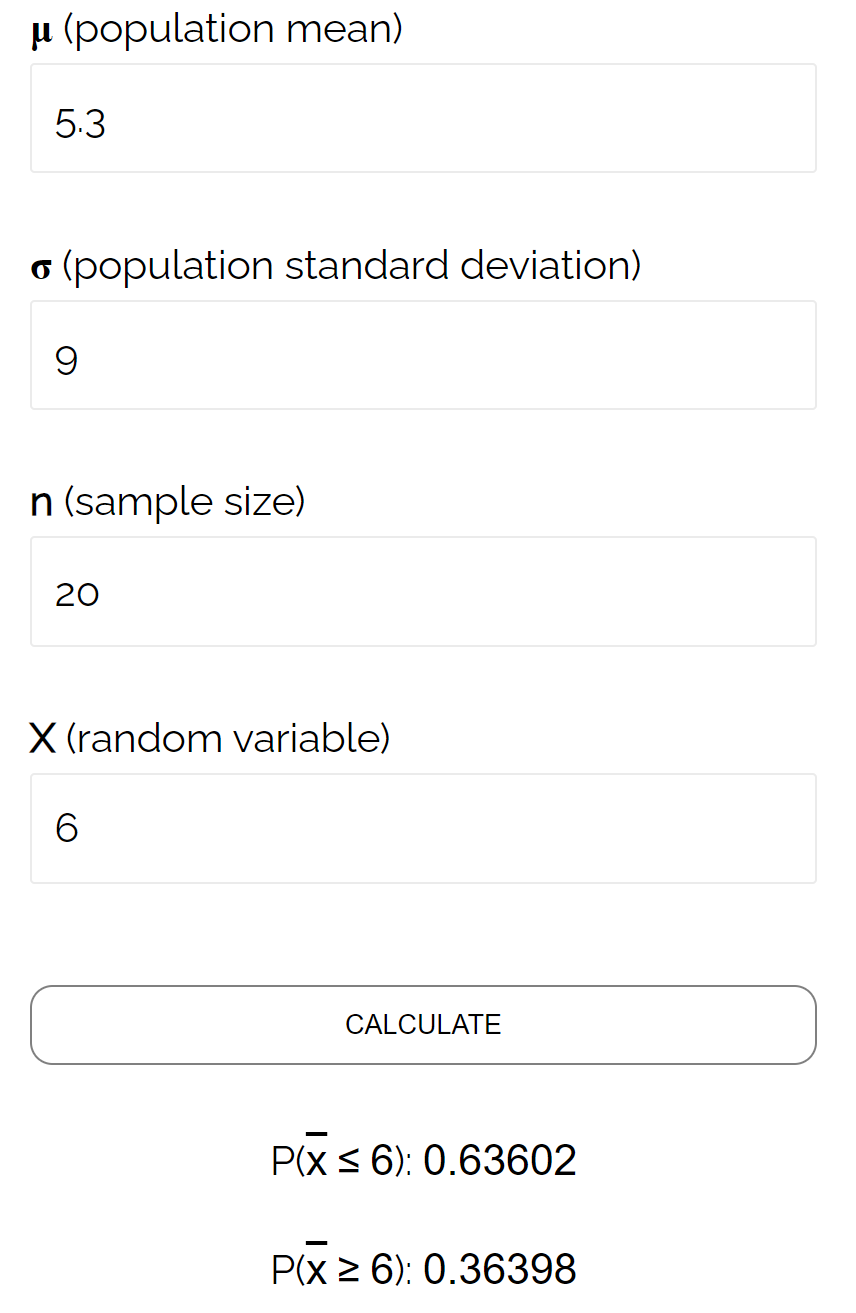
Sampling Distribution Of The Mean

The concept of the sampling distribution of the mean is a fundamental idea in statistics, playing a crucial role in understanding how sample statistics relate to population parameters. This concept is essential for making inferences about a population based on sample data, which is a common task in various fields, including social sciences, medicine, and business. The sampling distribution of the mean, in simple terms, refers to the distribution of the sample means when repeated samples of a fixed size are taken from a population.
To delve into this concept, let’s start by understanding the basic components and how they contribute to the overall understanding of statistical inference.
Population vs. Sample
- Population: This refers to the entire group of individuals, items, or data points that one is interested in understanding or describing. It is the whole scope of the data from which information is to be obtained.
- Sample: A sample is a subset of the population that is used to gain insights into the characteristics of the population. Since collecting data from an entire population can be impractical, time-consuming, and expensive, samples are used to make inferences about the population.
Sampling Distribution
A sampling distribution is a probability distribution of a statistic obtained through a large number of samples of size n from a population. It serves as a theoretical distribution that would result if we were to take an infinite number of samples from the population, each of size n, and compute the sample statistic (like the mean) for each sample.
Characteristics of the Sampling Distribution of the Mean
The sampling distribution of the mean has several important characteristics:
Mean of the Sampling Distribution: The mean of the sampling distribution of the mean is equal to the population mean (μ). This indicates that the sample mean is an unbiased estimator of the population mean.
Standard Deviation of the Sampling Distribution: The standard deviation of the sampling distribution of the mean, also known as the standard error of the mean (SEM), is equal to the population standard deviation (σ) divided by the square root of the sample size (n). This relationship (SEM = σ / √n) shows that as the sample size increases, the standard deviation of the sampling distribution decreases, indicating that larger samples provide more precise estimates of the population mean.
Shape of the Sampling Distribution: According to the Central Limit Theorem (CLT), the sampling distribution of the mean will be approximately normally distributed if the sample size is sufficiently large (usually ≥ 30), regardless of the shape of the population distribution. This is a powerful tool because it allows us to use normal distribution theory for making inferences, even when the population distribution is not known to be normal.
Practical Applications
The concept of the sampling distribution of the mean has numerous practical applications in statistical analysis and inference:
Confidence Intervals: The sampling distribution of the mean is used to construct confidence intervals for the population mean. A confidence interval provides a range of values within which the population mean is likely to lie, based on a given level of confidence.
Hypothesis Testing: The sampling distribution of the mean plays a critical role in hypothesis testing regarding the population mean. It helps in determining whether observed differences between sample means and known or hypothesized population means are statistically significant.
Estimating Population Mean: By understanding the characteristics of the sampling distribution of the mean, researchers can use sample data to estimate the population mean with a known level of precision, which is essential in planning and interpreting the results of studies.
Challenges and Considerations
While the concept of the sampling distribution of the mean is powerful, there are several challenges and considerations that researchers must keep in mind:
Sample Size Determination: Deciding on the appropriate sample size is crucial. Larger samples generally provide more precise estimates but are more resource-intensive.
Assumptions of the Central Limit Theorem: While the CLT provides a basis for using normal distribution theory, it’s essential to verify that the sample size is sufficiently large and that the population distribution does not significantly deviate from normality for the specific parameter of interest.
Non-Random Sampling: If the sampling method is not random, it may introduce biases that affect the validity of the inferences made about the population.
Conclusion
The sampling distribution of the mean is a foundational concept in statistical inference, allowing researchers to understand how sample means relate to population means. By grasping the characteristics of this distribution, including its mean, standard deviation, and shape, researchers can use sample data to make informed decisions about populations. This concept underpins many statistical procedures, from confidence intervals to hypothesis testing, and its applications are diverse, impacting fields from medicine and social sciences to business and economics.
What is the primary use of the sampling distribution of the mean in statistics?
+The primary use of the sampling distribution of the mean is to make inferences about the population mean based on sample data. It helps in understanding how the sample mean is likely to vary from the true population mean, enabling the construction of confidence intervals and the testing of hypotheses regarding the population mean.
How does the Central Limit Theorem affect the shape of the sampling distribution of the mean?
+According to the Central Limit Theorem, the sampling distribution of the mean will be approximately normally distributed if the sample size is sufficiently large, regardless of the shape of the population distribution. This approximation becomes more accurate as the sample size increases.
What factors influence the standard deviation of the sampling distribution of the mean?
+The standard deviation of the sampling distribution of the mean, or the standard error of the mean, is influenced by two main factors: the population standard deviation and the sample size. It is calculated as the population standard deviation divided by the square root of the sample size, indicating that larger samples lead to smaller standard errors and thus more precise estimates.


