Standard Normal Z Table

The standard normal z-table, also known as the z-score table or standard normal distribution table, is a mathematical table that provides the probability that a random variable with a standard normal distribution will be less than or equal to a given z-score. The z-score is a measure of how many standard deviations an observation is away from the mean of the distribution.
Understanding the Standard Normal Distribution

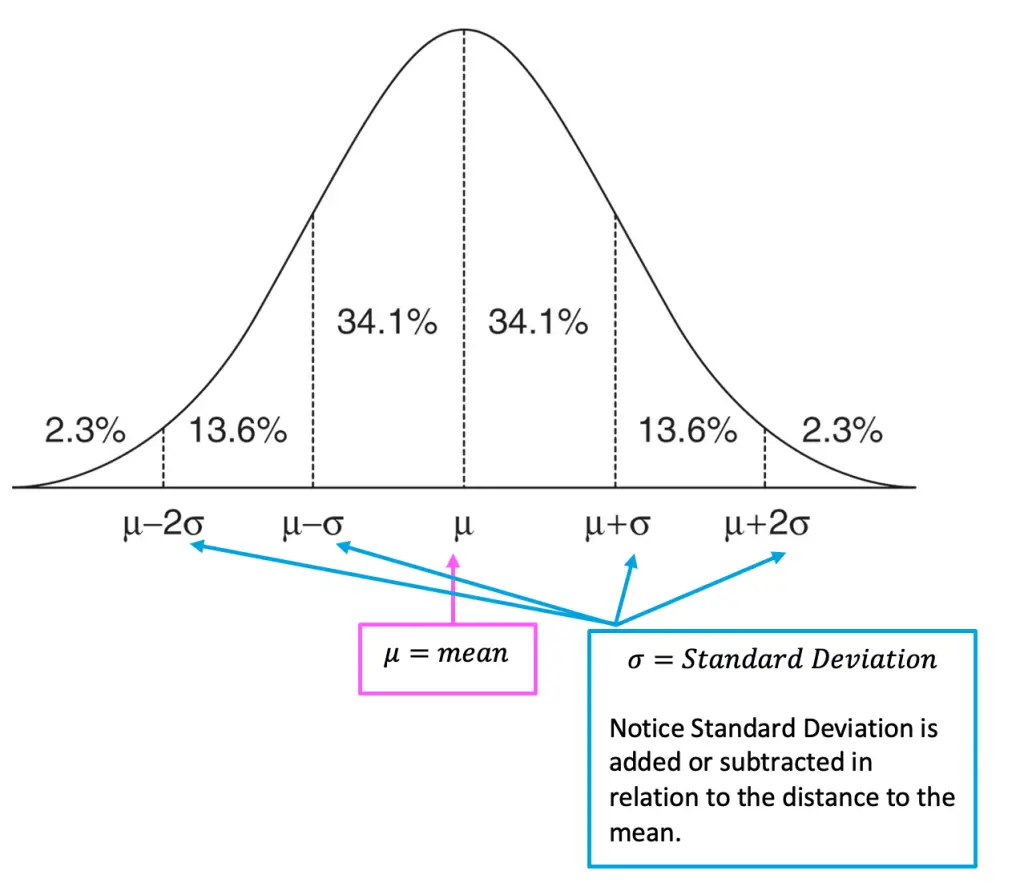
The standard normal distribution, denoted by Z, is a normal distribution with a mean (μ) of 0 and a standard deviation (σ) of 1. It is a continuous probability distribution that is symmetric about the mean, showing that data near the mean are more frequent in occurrence than data far from the mean. In a standard normal distribution, about 68% of the data falls within one standard deviation of the mean, about 95% falls within two standard deviations, and about 99.7% falls within three standard deviations.
Interpreting the Z-Table

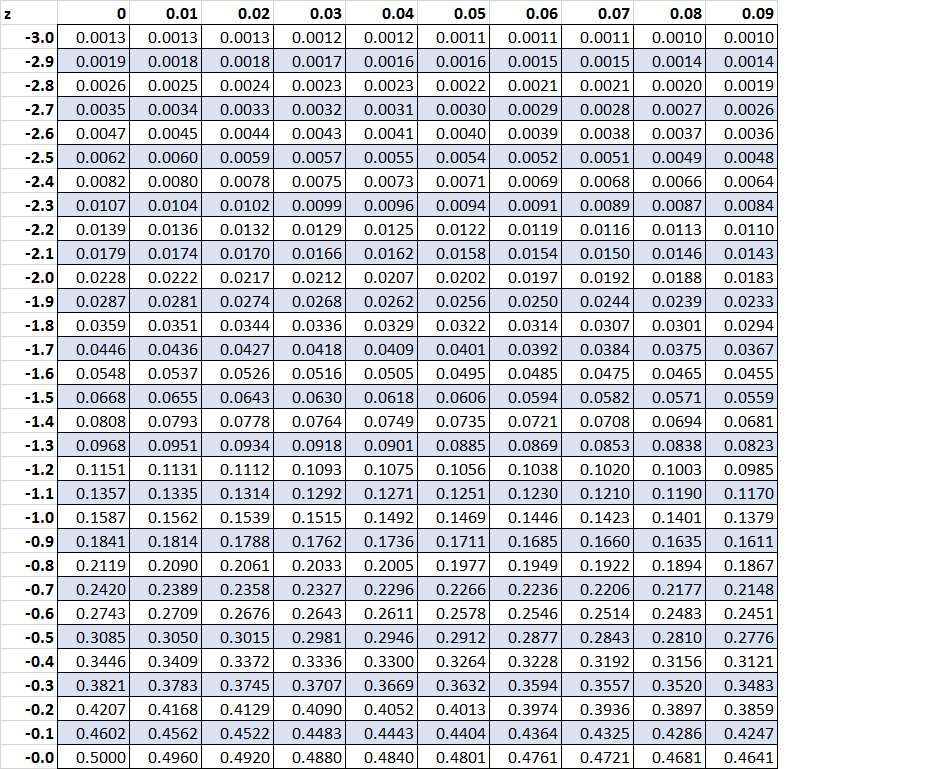
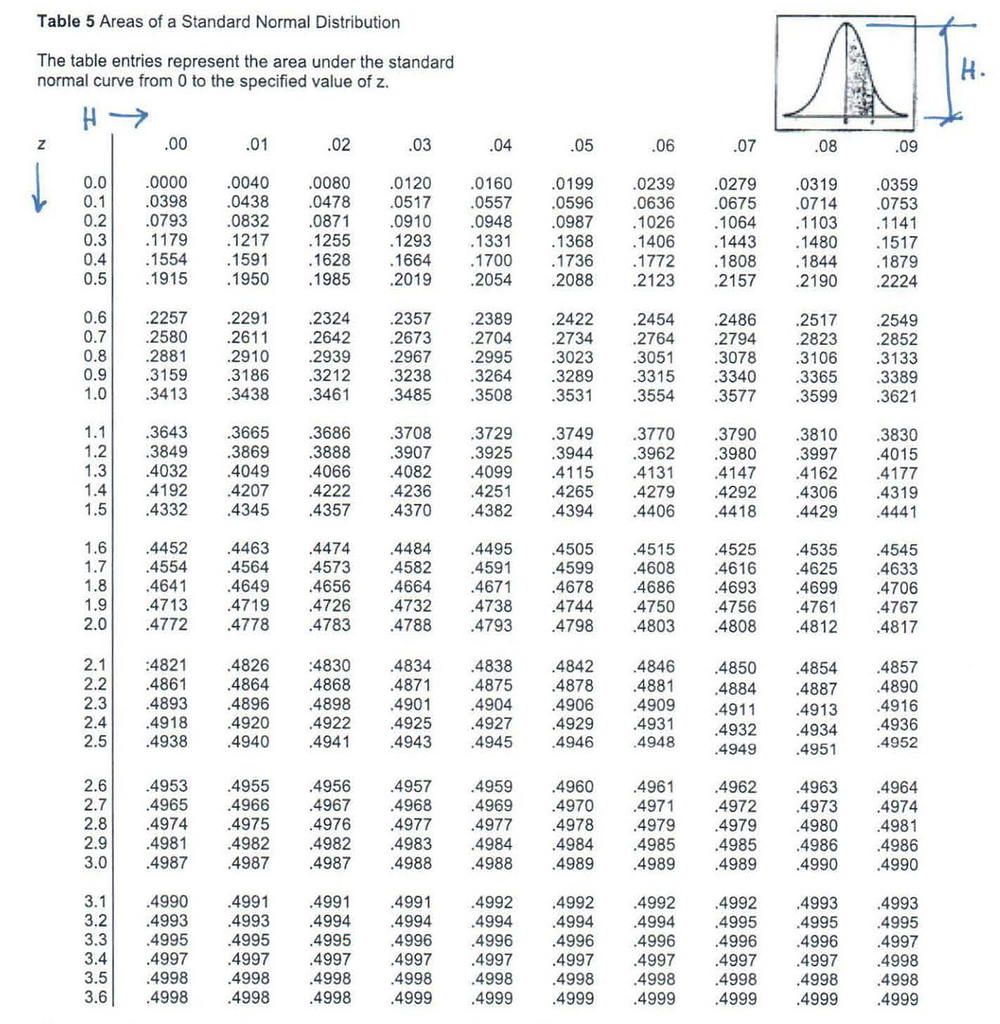
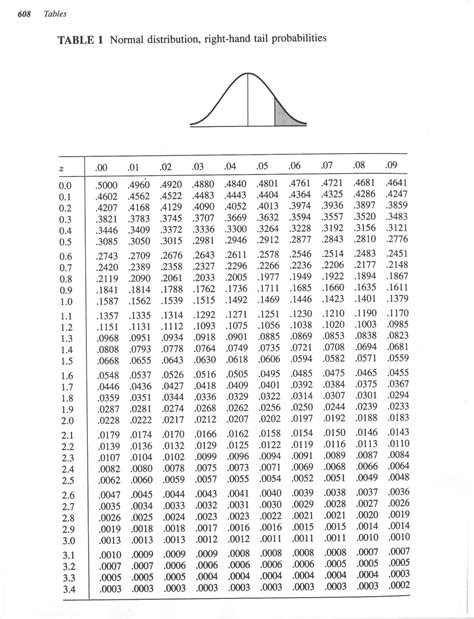
The standard normal z-table is typically divided into two parts: the body of the table and the margins. The body of the table contains the cumulative probabilities (areas under the curve) from the left (negative infinity) up to the z-score value. The margins provide the z-score values.
- Columns: The first column (or the row headers on the left side for some tables) lists the z-scores up to the first decimal place.
- Rows: The top row (or the column headers) lists the second decimal place of the z-scores, ranging from 0.00 to 0.09.
- Body Cells: Each cell within the table gives the area under the standard normal curve to the left of the z-score. For example, if you look up a z-score of 1.23, you would find the area to the left of this z-score.
Using the Z-Table
To use the z-table, you typically follow these steps:
- Determine the Z-Score: First, you need to calculate the z-score of the value you’re interested in, using the formula z = (X - μ) / σ, where X is the value, μ is the mean, and σ is the standard deviation.
- Look Up the Z-Score in the Table: With the z-score calculated, you look it up in the table. If your z-score is positive, you look in the main body of the table. If it’s negative, you can either use the symmetry of the standard normal distribution to find the corresponding positive z-score or look for tables that directly provide areas for negative z-scores.
- Find the Probability: The value in the table corresponding to your z-score gives you the probability (area under the curve) from the left up to your z-score.
Example Usage
Suppose you want to find the probability that a random variable is less than 1.23 standard deviations above the mean. You would:
- Calculate the z-score (which in this case is given as 1.23).
- Look up 1.23 in the z-table.
- Find the corresponding probability. Let’s say the table indicates a probability of 0.8907. This means there is a 89.07% chance that the random variable is less than 1.23 standard deviations above the mean.
Limitations and Considerations

- One-Tailed vs. Two-Tailed Tests: The z-table directly provides probabilities for one-tailed tests (looking at one side of the distribution). For two-tailed tests, where you’re interested in both tails of the distribution, you need to adjust the probability accordingly.
- Interpolation: Sometimes, the exact z-score you’re looking for may not be listed. In such cases, interpolation between the nearest values can provide a more accurate estimate.
- Understanding Z-Scores: It’s crucial to understand that a z-score indicates how many standard deviations an element is from the mean. A z-score of 0 means the value is equal to the mean, a positive z-score indicates a value above the mean, and a negative z-score indicates a value below the mean.
Practical Applications
The standard normal z-table has widespread applications in statistics, particularly in hypothesis testing and confidence intervals. It’s a fundamental tool in understanding and working with data that follows a normal distribution or can be transformed to follow one. Whether in quality control, finance, social sciences, or engineering, understanding how to use the z-table can help in making informed decisions based on data analysis.
Frequently Asked Questions
What is a standard normal distribution?
+A standard normal distribution, denoted by Z, is a normal distribution with a mean of 0 and a standard deviation of 1. It serves as a reference distribution for comparing the distributions of other variables.
How do I calculate a z-score?
+The z-score formula is z = (X - μ) / σ, where X is the value of interest, μ is the population mean, and σ is the population standard deviation.
What does the z-table show?
+The z-table shows the area under the standard normal curve to the left of a given z-score, essentially providing the probability that a random variable with a standard normal distribution will be less than or equal to the z-score.
By understanding and effectively using the standard normal z-table, individuals can gain insights into the probabilities associated with normal distributions, facilitating more accurate predictions and informed decision-making in a wide range of fields.


